Hello
I'm Neeta
With over 6 years of hands-on experience in financial operations and public sector HR systems, I’m a business data analyst passionate about turning complexity into clarity. From optimizing Power BI dashboards for California’s judiciary to generating bond waterfall reports for major loan portfolios, I bring a sharp eye for patterns and a drive to make data actionable. Whether it’s streamlining HR reporting or ensuring investor compliance, I thrive where data meets impact. Welcome to my portfolio—where precision fuels insight and decisions are backed by data.

Analytical Acumen
Proven expertise in uncovering actionable insights from complex datasets, enabling data-driven decision-making.
Problem-Solving Prowess:
Known for tackling intricate data challenges with innovative solutions.
Continuous Learner
Avidly staying updated with emerging data trends and technologies, driving ongoing professional growth.
Remote Collaboration
Proficient in thriving as a remote team player, fostering seamless communication and achieving project milestones.
Why Hire Me?
As an experienced data analyst with 6 years of expertise in the Operation and SupplyChain, I possess the tenacity to tackle real-time challenges and turn data into actionable insights. My passion for innovation and dedication to precision make me the ideal candidate for any remote data analyst role. Let's collaborate and unlock the full potential of your data-driven success.
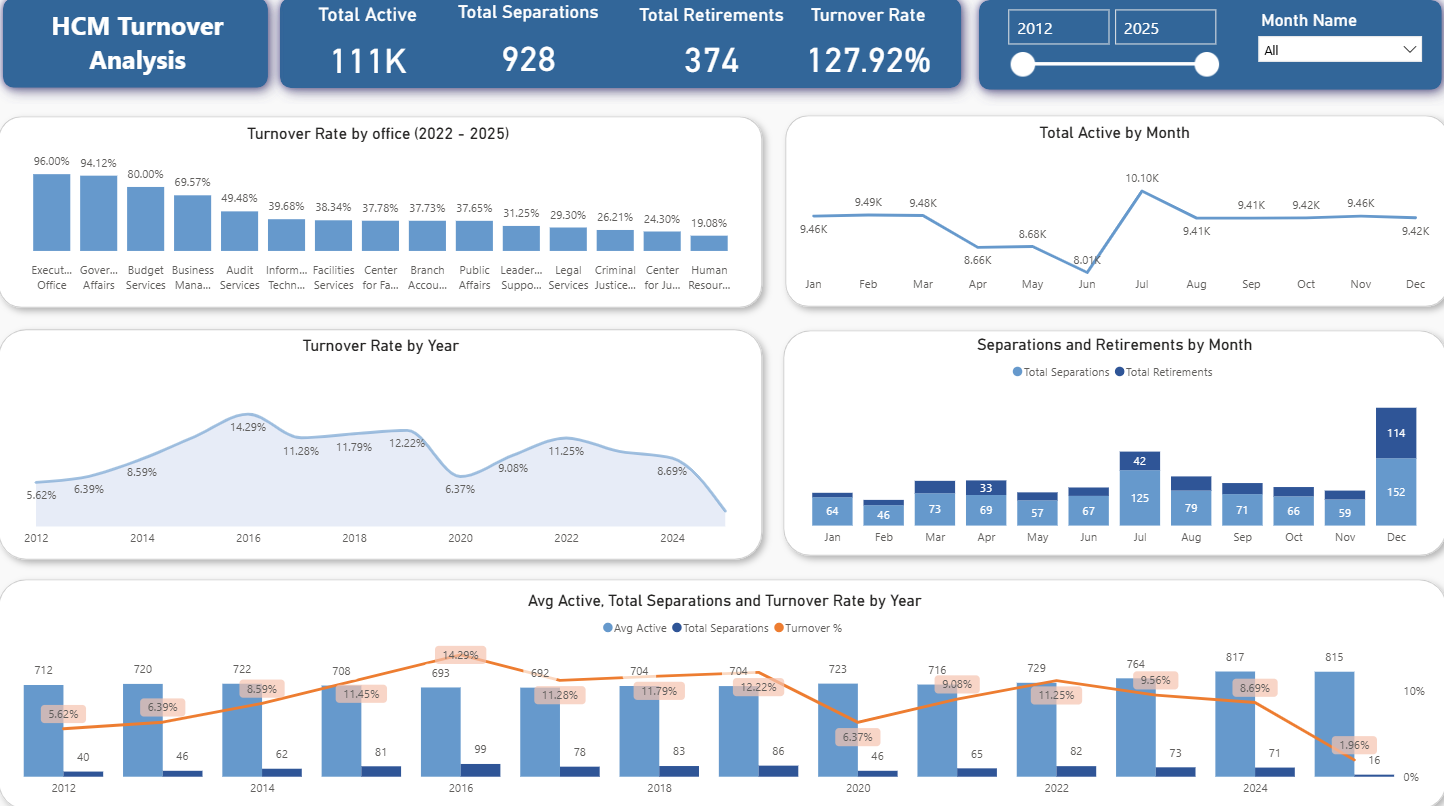
HCM Turnover Analysis
Immerse yourself in data analysis with my engaging Power BI project focused on HCM Turnover Analysis. Discover key insights through interactive visualizations that highlight employee attrition trends, turnover rates, and departmental impacts. This project showcases advanced techniques in data modeling, visualization design, and dynamic filtering within Power BI. Demonstrating expertise in transforming raw HR data into actionable business intelligence, it features innovative visuals that adapt based on selected demographics, such as department, tenure, and job role. Experience the art of visual storytelling through a comprehensive analysis of organizational workforce dynamics.
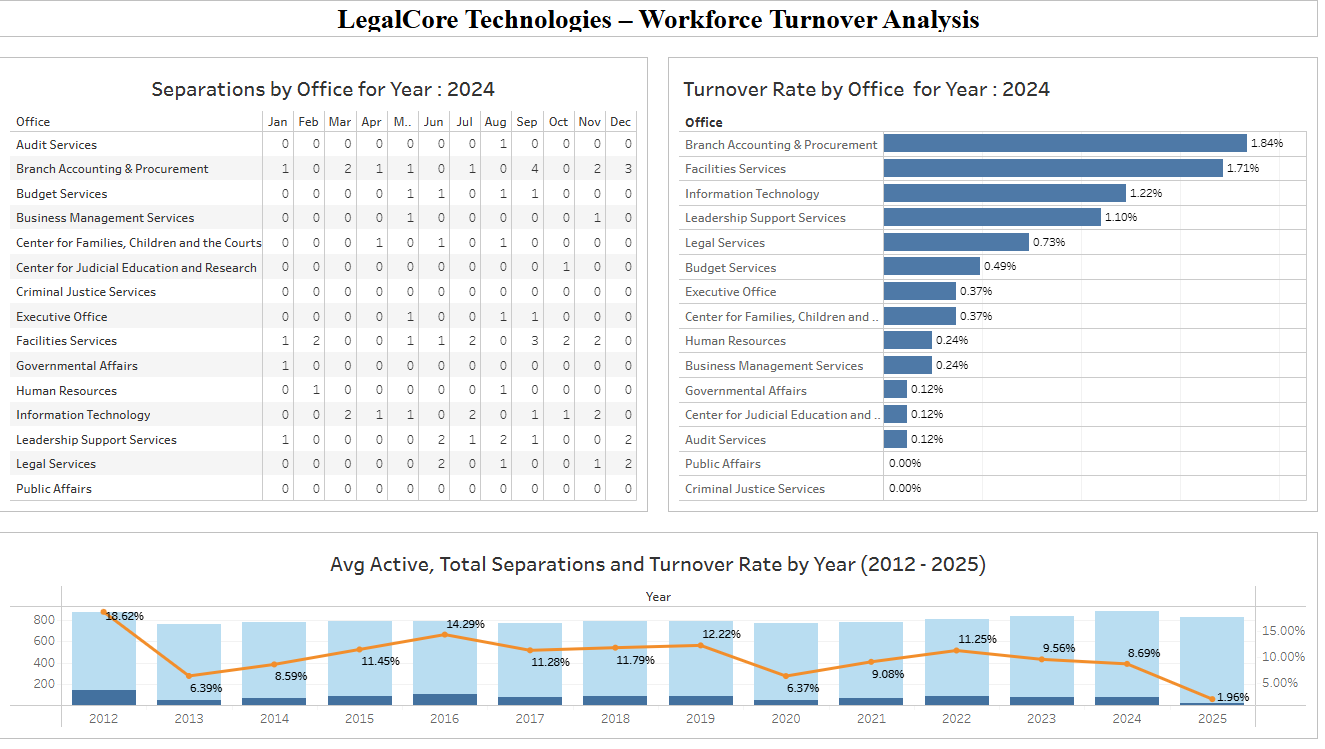
LegalCore Technologies – Workforce Turnover Analysis
Gain critical insights into employee dynamics with this professional Tableau dashboard focused on workforce turnover analysis at LegalCore Technologies. This advanced visualization project explores key HR metrics, including employee tenure, department-wise attrition rates, job roles, exit reasons, age distribution, and employment status. Engaging visuals such as bar charts, heat maps, and trend lines offer a deep dive into turnover patterns across different departments and locations. Users can filter by job level, gender, and resignation cause to uncover actionable insights. Designed with clarity and precision, this dashboard empowers organizations to understand and address workforce trends effectively.
Hotel Booking Analytics Dashboard in Excel
This Excel dashboard analyzes hotel booking data from 2018 to 2020, offering insights into trends, customer behavior, and operational performance. It covers booking patterns by date, hotel, room type, and channel, as well as cancellation trends and guest preferences.
Key recommendations include optimizing deposit policies to reduce cancellations, focusing on high-performing channels and room types, and enhancing retention through loyalty programs and personalized offers.
Built using Microsoft Excel with PivotTables, slicers, and visualizations for interactive data analysis.
Apple Store Insights: Data-Driven App Development
Explore valuable insights for app developers with App Store Insights, a project that leverages SQL to analyze key trends in the Apple App Store. This analysis uncovers patterns in popular app genres, pricing strategies, and user rating behaviors to help developers make informed decisions.
By applying data-driven methods, this project empowers developers to enhance their app development strategies and stand out in the competitive app marketplace. The SQL-based approach ensures reliable insights that support successful and efficient app creation.

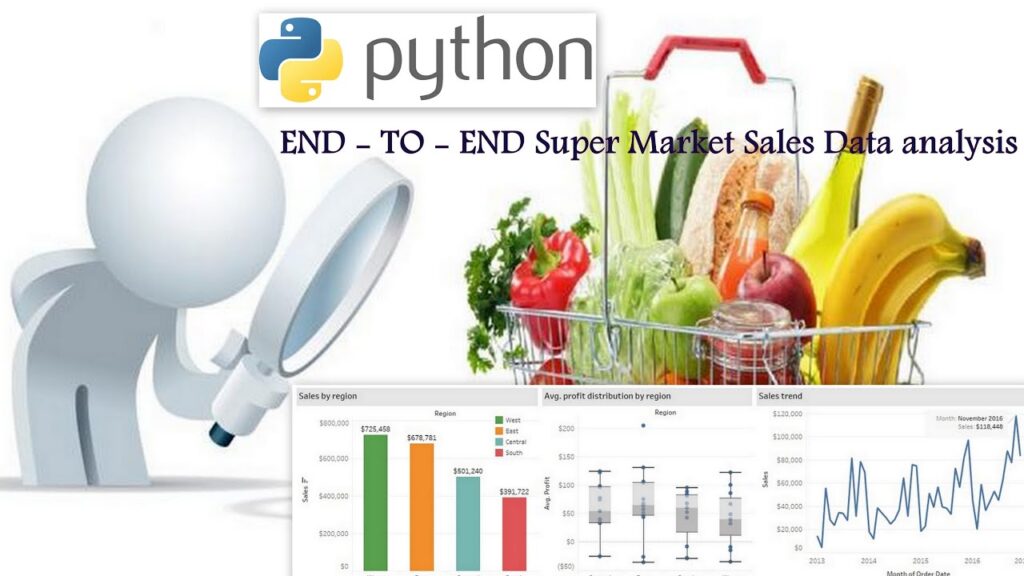
Festive Sales Insights
Discover customer behavior and sales trends during festive seasons through targeted data analysis with Python. By examining transaction data, this project uncovers shifts in consumer preferences, shopping frequency, and spending habits. Visualizations turn complex patterns into actionable insights, helping businesses make smarter, faster decisions during peak times.
The analysis also explores key demographics, regional buying trends, and top-performing product categories. It highlights which customer segments and locations drive the most revenue, and which products gain popularity during festive periods. These insights support effective marketing, smarter inventory planning, and stronger sales strategies.
Let's Work Together
Ready to collaborate on data-driven projects? I'm eager to bring my expertise in Power BI, Tableau, SQL, Python, and data analysis to your team. Let’s turn insights into action and build impactful solutions together. Contact me to explore exciting opportunities.