
Tableau Tales Unleashed
Welcome to the captivating world of Tableau, where data storytelling meets compelling visualizations. Explore my Tableau projects, each featuring interactive visuals, vibrant charts, and insightful analyses. Dive deep into data with a touch of creativity that brings every project to life. Discover meaningful patterns and trends presented in an engaging and artistic way. Whether you’re an employer seeking data expertise or a freelancer interested in collaboration, join me on this exciting journey of data-driven discovery.

D
ata Modeling
Robust data relationships and structuring.
Interactive Dashboards
Engaging visualizations for data exploration.
Actionable Insights
Empowering data-driven decision-making.
Data Cleaning
Ensuring accurate and reliable data
Advanced Analytic
Powerful insights through advanced calculations.
Custom Visualizations
Tailored visuals for impactful storytelling.
Interactive Reports
Intuitive and dynamic data exploration.
Data Prep Excellence
Efficient data preparation for analysis.
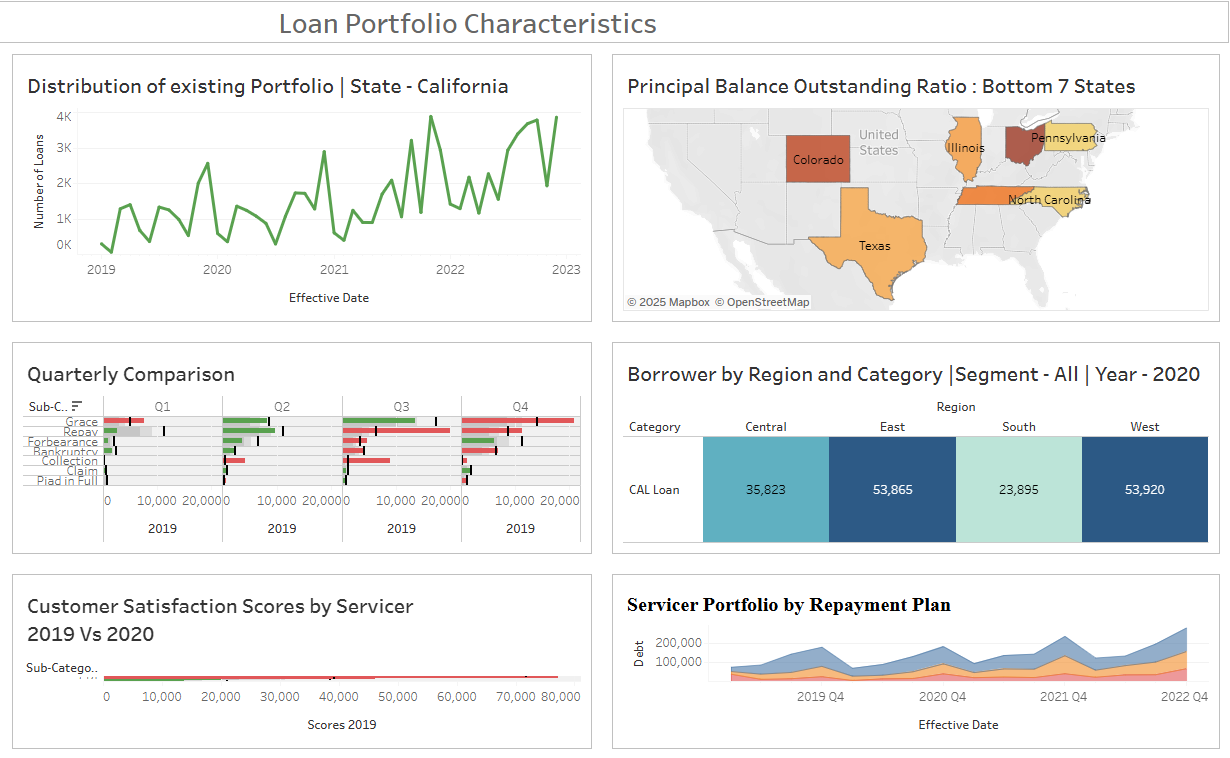
Loan Portfolio Characteristics
Delve into the intricate landscape of loan portfolio characteristics through my advanced Tableau project. This comprehensive dashboard visualizes key metrics such as loan amounts, interest rates, credit scores, and loan terms across various customer segments. Explore insights based on loan status, risk category, and customer demographics. Discover the top 10 loan types by volume and analyze portfolio distribution by region and lending institution size. An interactive map illustrates regional loan patterns and concentrations. Step into the world of financial analytics as I demonstrate how to build this data-rich dashboard, equipping you with the tools to interpret loan portfolio dynamics with confidence.
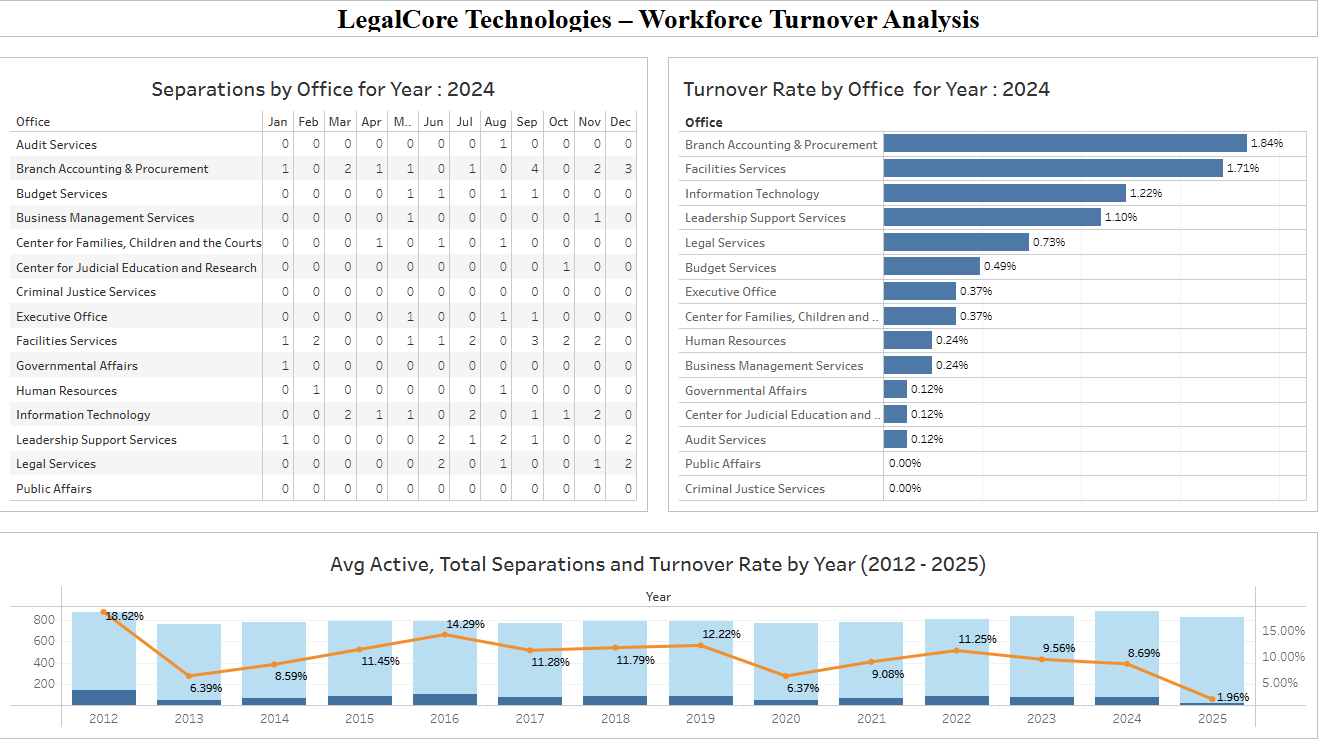
LegalCore Technologies – Workforce Turnover Analysis
- Gain critical insights into employee dynamics with this professional-grade Tableau dashboard focused on workforce turnover analysis at LegalCore Technologies. This advanced visualization project explores key HR metrics, including employee tenure, department-wise attrition rates, job roles, exit reasons, age distribution, and employment status. Engaging visuals such as bar charts, heat maps, and trend lines offer a deep dive into turnover patterns across different departments and locations. Users can filter by job level, gender, and resignation cause to uncover actionable insights. Designed with clarity and precision, this dashboard empowers organizations to understand and address workforce trends effectively.
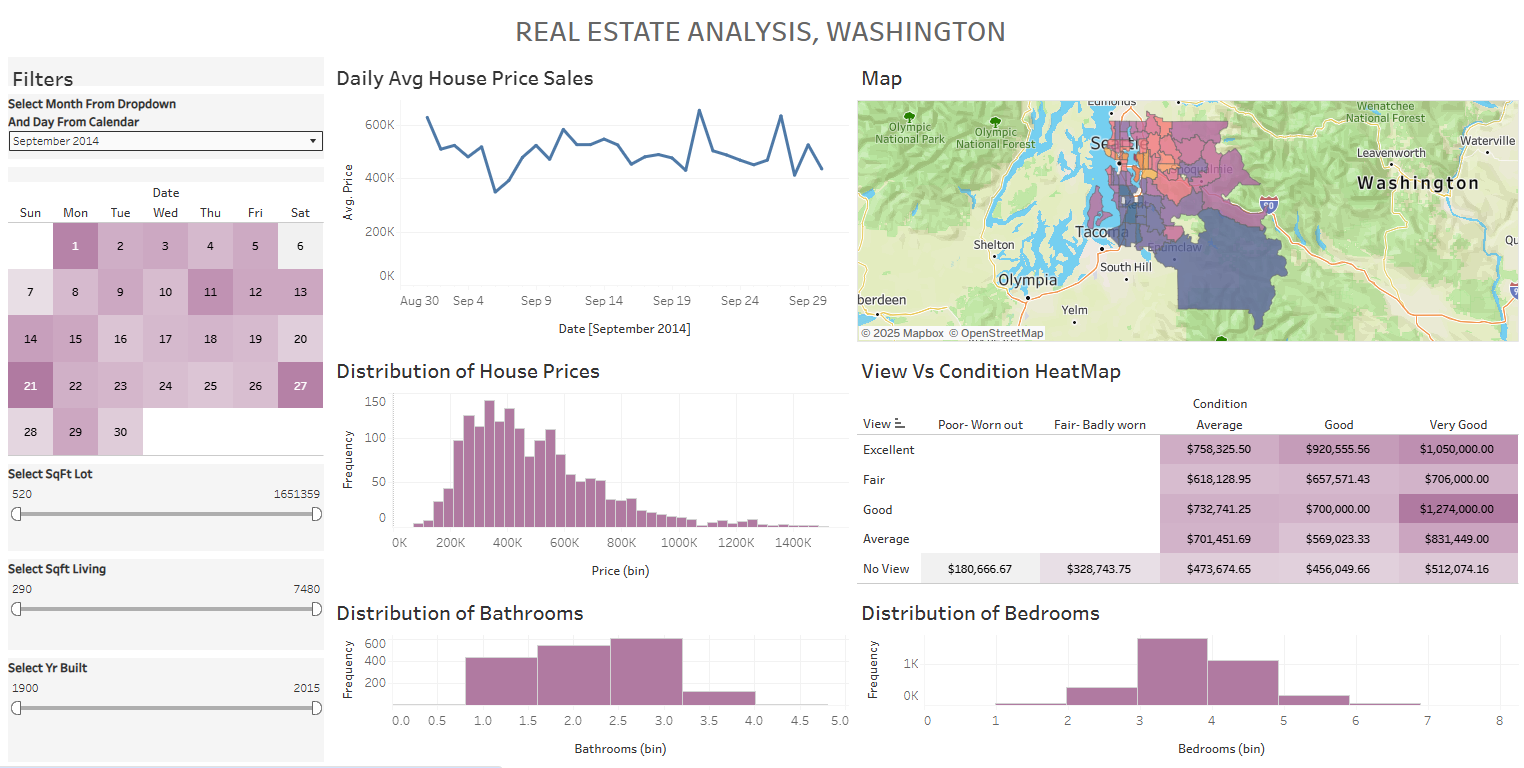
Real Estate Analysis, Washington
Explore the dynamic landscape of Washington’s real estate market with this comprehensive Tableau dashboard. Gain valuable insights into property types, average prices by neighborhood, housing availability, and trends in property size and construction year. Visualizations are skillfully designed using advanced Tableau features to simplify complex real estate data into clear, interactive, and insightful formats. This project empowers investors, buyers, and analysts to make data-driven decisions by highlighting market trends and regional property dynamics. Dive into the world of real estate analytics as I demonstrate how data visualization can transform raw housing data into strategic insights.
Let's Work Together
Ready to collaborate on data-driven projects? I’m eager to bring my expertise in Power BI, Tableau, SQL, Python, and data analysis to your team. Let’s turn insights into action and create impactful solutions together. Please feel free to contact me to explore exciting opportunities.
